Next: 3.6 Multigrain FePt/FeRh material Up: 3. Multiscale modeling of Previous: 3.4 Simulations of one Contents
We will study the switching properties of a soft/hard bilayer film
using two different models.
The first will be a standard micromagnetic model and the second the
multiscale modeling already introduced
in Section 2.2.4. From their
comparison with the previous results of a 1-D model by K. Guslienko et
al. [Guslienko 04], which
will be referred in this section as ``1D'' model, we will show the
necessity of multiscale modeling in the case of imperfect interfaces.
The system modeled, represented in Fig. 3.15,
has thicknesses of ![]() of FePt and
of FePt and ![]() of FeRh
and the in-plane dimensions are
of FeRh
and the in-plane dimensions are ![]() .
Periodic boundary conditions in the magnetostatic potential as well as
in the exchange interaction are used in x,y directions, but not in z
direction where free boundary conditions are used. Due to the system
configuration and the periodic boundary conditions, the magnetostatic
interaction yields an in-plane shape anisotropy equivalent to that of
an infinite film. The temperature is supposed to be higher than the
transition temperature, therefore, the FeRh is in its ferromagnetic
state. The magnetocrystalline anisotropy of the FeRh was neglected and
due to its large saturation magnetization the shape anisotropy is
predominant. The easy axis of the FePt was parallel to the z direction,
normal to the film plane. The following value of the material constants
were used:
.
Periodic boundary conditions in the magnetostatic potential as well as
in the exchange interaction are used in x,y directions, but not in z
direction where free boundary conditions are used. Due to the system
configuration and the periodic boundary conditions, the magnetostatic
interaction yields an in-plane shape anisotropy equivalent to that of
an infinite film. The temperature is supposed to be higher than the
transition temperature, therefore, the FeRh is in its ferromagnetic
state. The magnetocrystalline anisotropy of the FeRh was neglected and
due to its large saturation magnetization the shape anisotropy is
predominant. The easy axis of the FePt was parallel to the z direction,
normal to the film plane. The following value of the material constants
were used: ![]() and
and ![]() .
.
In the micromagnetic simulations, as well as in the micromagnetic
zones in the
multiscale model, we used the discretization length of ![]() (smaller
than the domain wall width in FePt of
(smaller
than the domain wall width in FePt of ![]() ), therefore, the total number of cells
in the film is
), therefore, the total number of cells
in the film is ![]() . The validity of our
micromagnetic simulations
depends on the correct domain wall description. We have checked that
the
numerically calculated domain wall profile in pure FePt has the correct
width
in comparison to the theoretical prediction. In Fig. 3.16 we present
a comparison between a perpendicular exchange spring (the dependence
. The validity of our
micromagnetic simulations
depends on the correct domain wall description. We have checked that
the
numerically calculated domain wall profile in pure FePt has the correct
width
in comparison to the theoretical prediction. In Fig. 3.16 we present
a comparison between a perpendicular exchange spring (the dependence ![]() )
calculated within 1-D atomistic approach and 3-D micromagnetic
simulations when
the exchange between the two layers has almost the bulk value. Although
the two
models give slightly different coercive fields, for applied fields
close to the
switching field the domain walls are almost identical. Therefore, our
micromagnetic approach correctly describes the domain wall formation in
this
(strongly coupled) case.
)
calculated within 1-D atomistic approach and 3-D micromagnetic
simulations when
the exchange between the two layers has almost the bulk value. Although
the two
models give slightly different coercive fields, for applied fields
close to the
switching field the domain walls are almost identical. Therefore, our
micromagnetic approach correctly describes the domain wall formation in
this
(strongly coupled) case.
![\includegraphics[height=7.cm]{Capitulo3/Graficas3/mmm1}](img540.gif)
|
![\includegraphics[height=7.cm]{Capitulo3/Graficas3/graciclos}](img541.gif)
|
Now we will compare the calculations of the micromagnetic model with
that of
the multiscale model when the interfacial exchange is small. The
multiscale model has been
already described in Section 2.2.4,
but in this case the atomistic region
has twice the macromagnetic cell size in each material, giving a
thickness of ![]() treated
atomistically on both the FePt and FeRh sides of the interface. The
demagnetization curves for interfacial exchange value
treated
atomistically on both the FePt and FeRh sides of the interface. The
demagnetization curves for interfacial exchange value ![]() are shown in
Fig. 3.17. Unlike the one-grain model,
the hysteresis cycle of the FeRh part represents a rotation of the
magnetization into the easy plane. In this case also an exchange
spring is formed at the interface. However, this domain wall represents
a magnetization
rotation of
are shown in
Fig. 3.17. Unlike the one-grain model,
the hysteresis cycle of the FeRh part represents a rotation of the
magnetization into the easy plane. In this case also an exchange
spring is formed at the interface. However, this domain wall represents
a magnetization
rotation of ![]() degrees
rather than a
degrees
rather than a ![]() degree
wall as in the isolated grain. This reversible
rotation and the nucleation at positive fields is typical for a hard
axis loop.
The loops presents a
jump corresponding to the depinning of the domain wall and the complete
switching of the hard layer. We can observe that, in the multiscale
model the
complete reversal of the soft layer is not needed to reverse the hard
layer.
The results of calculations of domain wall structures using the
multi-scale
model are shown in Fig. 3.18. It can be
seen that there is a
transition from the discontinuous domain wall structure at low
degree
wall as in the isolated grain. This reversible
rotation and the nucleation at positive fields is typical for a hard
axis loop.
The loops presents a
jump corresponding to the depinning of the domain wall and the complete
switching of the hard layer. We can observe that, in the multiscale
model the
complete reversal of the soft layer is not needed to reverse the hard
layer.
The results of calculations of domain wall structures using the
multi-scale
model are shown in Fig. 3.18. It can be
seen that there is a
transition from the discontinuous domain wall structure at low ![]() to a
continuous wall at a critical value of
to a
continuous wall at a critical value of ![]() . For
. For ![]() there is
little evolution of the domain wall structure. The predictions of the
multiscale model are in marked contrast to those of the micromagnetic
approach.
This is demonstrated comparing with Fig. 3.19,
which shows the
domain wall structures calculated using the micromagnetic model.
Although the value
there is
little evolution of the domain wall structure. The predictions of the
multiscale model are in marked contrast to those of the micromagnetic
approach.
This is demonstrated comparing with Fig. 3.19,
which shows the
domain wall structures calculated using the micromagnetic model.
Although the value ![]() is greater than the critical value
is greater than the critical value ![]() predicted by the multi-scale model, the micromagnetic calculation still
predicts a discontinuous domain wall. This is because the
micromagnetic determination of the exchange energy relies on a
long-wavelength
approximation, which underestimates the exchange energy associated with
rapid
spatial variation of the magnetization, thereby allowing discontinuous
domain wall
structures under conditions where these are not supported by the
atomistic
calculations. It appears that for the coercivity reduction, a
continuous domain
wall is necessary, as a consequence, the micromagnetic estimation of
the
critical exchange value is larger than the atomistic/multiscale
estimation. Clearly, a discontinuous domain wall structure, which has
an
interfacial energy larger than that required to achieve a continuous
domain
wall, requires a larger field to initiate the propagation of the domain
wall
leading to magnetization reversal.
predicted by the multi-scale model, the micromagnetic calculation still
predicts a discontinuous domain wall. This is because the
micromagnetic determination of the exchange energy relies on a
long-wavelength
approximation, which underestimates the exchange energy associated with
rapid
spatial variation of the magnetization, thereby allowing discontinuous
domain wall
structures under conditions where these are not supported by the
atomistic
calculations. It appears that for the coercivity reduction, a
continuous domain
wall is necessary, as a consequence, the micromagnetic estimation of
the
critical exchange value is larger than the atomistic/multiscale
estimation. Clearly, a discontinuous domain wall structure, which has
an
interfacial energy larger than that required to achieve a continuous
domain
wall, requires a larger field to initiate the propagation of the domain
wall
leading to magnetization reversal.
![\includegraphics[height=7.cm]{Capitulo3/Graficas3/wallmulti}](img548.gif)
|
![\includegraphics[height=6.5cm]{Capitulo3/Graficas3/wallmicro}](img549.gif)
|
![\includegraphics[height=7.cm]{Capitulo3/Graficas3/coerc}](img550.gif)
|
These limitations are also responsible for the failure of the
micromagnetic
model to predict saturation of the coercivity reduction until large
values of interfacial exchange. The variation of the coercivity with
interfacial
exchange energy ![]() for the
micromagnetic model is shown in Fig.
3.20. First we discuss the comparison with
the ``1D'' model.
Clearly, the micromagnetic model predictions differ significantly from
the ``1D'' atomic scale
model. It can be seen in Fig. 3.20, the
``1D'' model shows
saturation in the coercivity reduction at around
for the
micromagnetic model is shown in Fig.
3.20. First we discuss the comparison with
the ``1D'' model.
Clearly, the micromagnetic model predictions differ significantly from
the ``1D'' atomic scale
model. It can be seen in Fig. 3.20, the
``1D'' model shows
saturation in the coercivity reduction at around ![]() , whereas the
micromagnetic model predicts a continuous (albeit slow) decrease up to
the bulk
value of exchange.
, whereas the
micromagnetic model predicts a continuous (albeit slow) decrease up to
the bulk
value of exchange.
We can also compare our micromagnetic results with the analytical
expressions
of the pinning field Eq. (3.4).
In our case ![]() yielding a pinning field
yielding a pinning field ![]() (cf. the
value in Fig. 3.20). For the interfacial
exchange
value
(cf. the
value in Fig. 3.20). For the interfacial
exchange
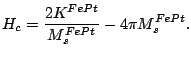
value ![]() the
coercive field of the FePt bilayer results from the shape and
the magnetocrystalline anisotropies, whose contributions are opposite
in sign:
the
coercive field of the FePt bilayer results from the shape and
the magnetocrystalline anisotropies, whose contributions are opposite
in sign:
In conclusion, we have demonstrated that the coercivity reduction in FePt/FeRh bilayers occurs via a complex reversal mechanism involving the penetration of an exchange spring from the soft FeRh into the hard FePt magnetic material. For weak interlayer coupling the standard micromagnetic approach cannot reproduce correctly this mechanism. We should notice here that several authors [Victora 05b] incorporate in their micromagnetic model special boundary conditions resulting from the counting the number of atomistic magnetic moments at the interface. Namely, the interfacial exchange is supposed to be of the form:
![\includegraphics[height=7.cm]{Capitulo3/Graficas3/rescalado}](img563.gif)
|
![\includegraphics[height=5.5cm]{Capitulo3/Graficas3/Sistema}](img532.gif)